Standalone SQL Log Analyser
This is a standalone web app that parses the SQL queries from the log and categorises them by tables and query types.
Motivation
While I was working in Freshworks, during feature development, I was expected to optimize each and every query that was fired as part of the feature. And many times the existing queries had to be optimized to have better response times.
In local development, it was very tiresome to look through the Rails server logs to find out the join queries, unexpected table's queries and unwanted load queries. In order to get a holistic and organised view of the queries from the Rails server logs, I wrote this tiny standalone app using angular.
Development
Learning Angular was one of the objectives of this hobby project. I experimented with angular for the first time while developing this (2014). I used the most primitive version of Angular for this. At that point in time, my style of learning things was to just get into it and do it. If you don't know something, search for it, learn it and do it.
The first plan of action for this to work was to find the SQL queries from the log. The second step was to parse the queries and categorise them by tables and query types. Fortunately enough, I found a javascript library called simpleSqlParser which does this. With that library and a UI powered by Angular, I created a V1 version of this.
Recently when I was going through this, I decided to use tailwind for CSS. The first version had a bunch of handwritten CSS styles and HTML packed with some Angular controllers. If you go through the older commits from 2014-15, you will see this.
Working
This web app does not require a backend and can run in any browser. This app is used to categorise the queries by tables and by type from the log. (If you are running a Rails server, you can directly copy-paste the server logs as it will have the SQL queries.)
To get this working, follow the following steps:
- You have two options to get hands-on with this.
- You can visit the live demo page
- Or set this up in local environment by
- Cloning the repo using the following command :
git clone git@github.com:sony-mathew/sql-log-analyzer.git - and going to the cloned repo directory and open the
index.htmlfile in your browser.
- Cloning the repo using the following command :
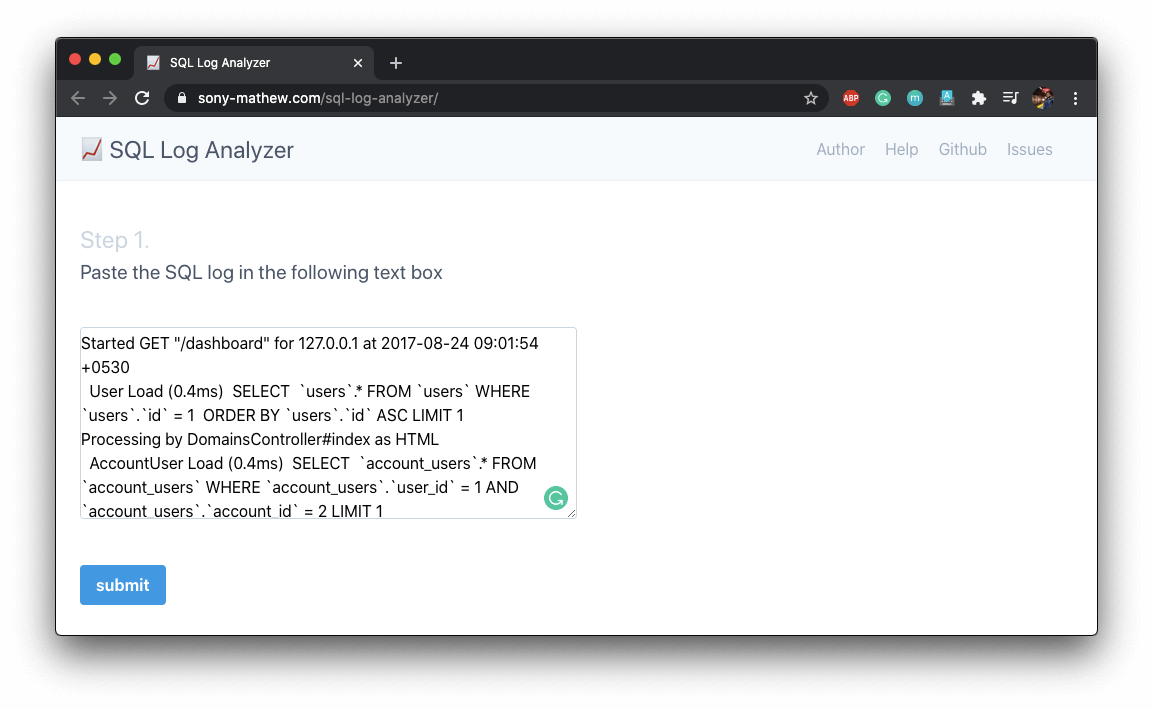
- The first page will have a plain text box to input the log. Copy and paste the server log in the text box. Click on Submit button.
- Voila. Now you will be shown a page where you can select the table. Now select a table from the dropdown.
- After selecting the table you can select the type of query related to that table.
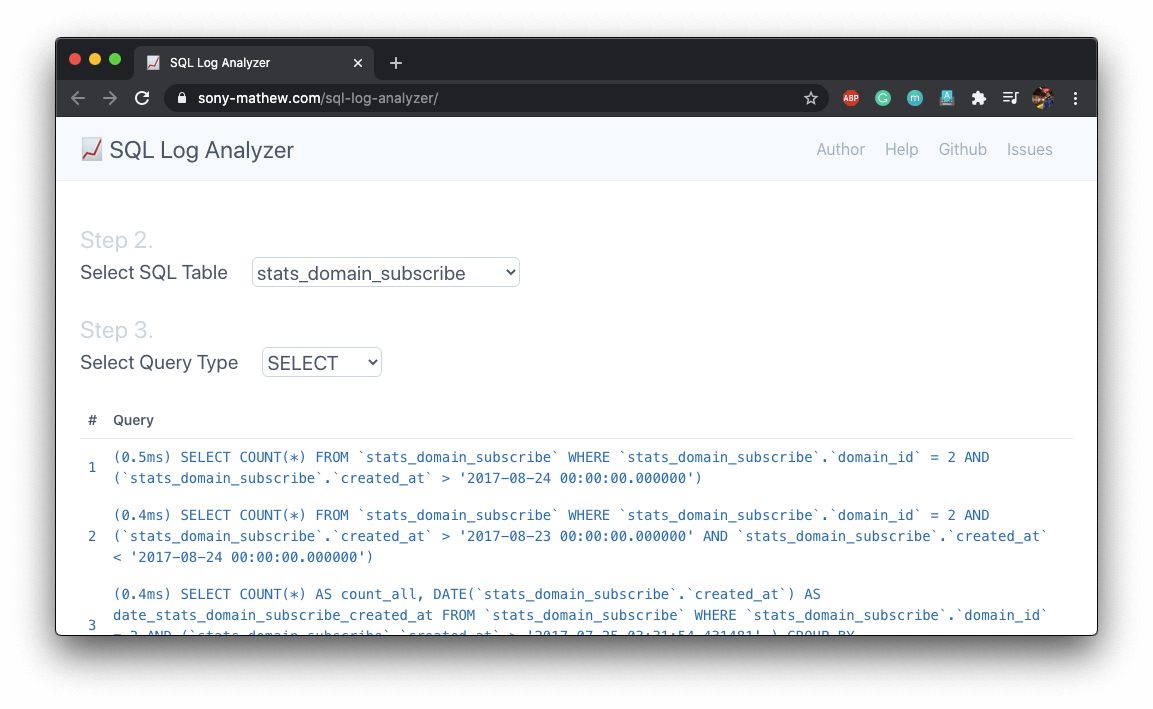
- As soon as you select the query type, all the queries of that type related to that table you selected will be listed below.
Optimizing Queries
With this, you have the list of tables and types of queries (JOINS, GROUP BY, WHERE conditions). Now the question is how do you take action on this.
I primarily worked with MySQL and Postgres. What I did with the above info was to find some suspicious queries (which had JOINS, WHERE, ORDER BY or GROUP BY). Once I isolated the queries which I think was non-performant, I used EXPLAIN on those queries. The EXPLAIN statement is used to obtain a query execution plan (that is, an explanation of how MySQL or Postgres would execute a query).
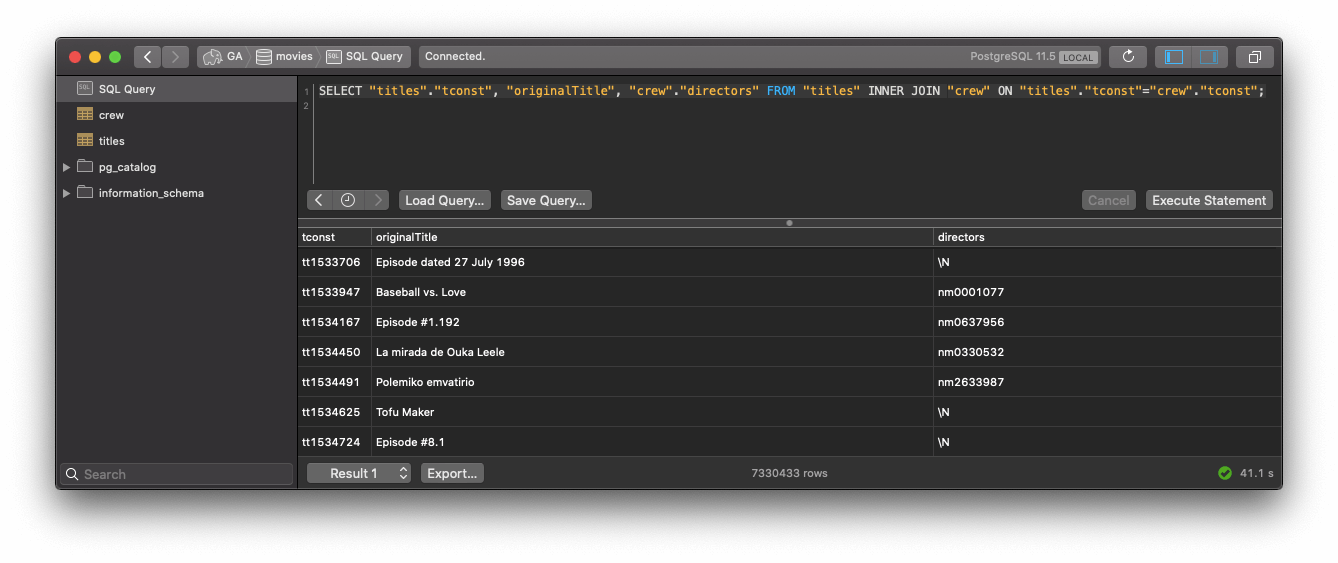
For example, consider the following query.
SELECT "titles"."tconst", "originalTitle", "crew"."directors" FROM "titles" INNER JOIN "crew" ON "titles"."tconst"="crew"."tconst";
This is the output for this query in the console.
When you do EXPLAIN on this query
EXPLAIN SELECT "titles"."tconst", "originalTitle", "crew"."directors" FROM "titles" INNER JOIN "crew" ON "titles"."tconst"="crew"."tconst";
you will get the following output
Hash Join  (cost=269460.21..750552.93 rows=7328951 width=38)
  Hash Cond: (titles.tconst = crew.tconst)
  ->  Seq Scan on titles  (cost=0.00..182196.51 rows=7328951 width=30)
  ->  Hash  (cost=134872.76..134872.76 rows=7330676 width=18)
        ->  Seq Scan on crew  (cost=0.00..134872.76 rows=7330676 width=18)
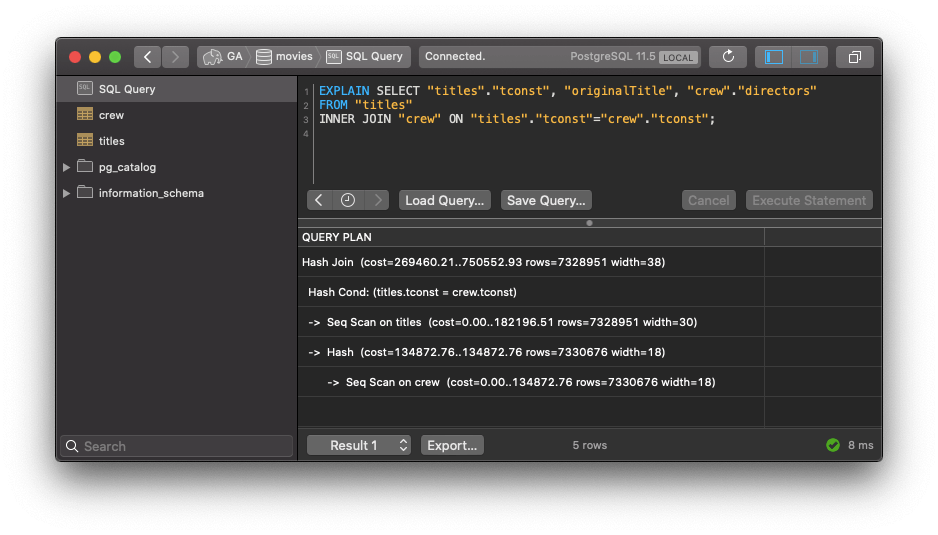
With this query plan, you can identify sequential scans performed. If there is an ORDER BY clause, you might see Using temporary; Using filesort; in the query plan. This will give an idea on which parts of the query is making it slow. Now it's up to you to take action on the slow parts of the query.
To fine-tune a query you have to go deeper and understand how each of the parts works. If you know how MySQL executes ORDER BY, you will do certain things to optimize that when you have an ORDER BY in your SQL query. This is not an everyday scenario in smaller companies. This becomes relevant when you are at scale and avoiding the bottlenecks, optimizing the system and resources for maximum performance and output.
Bonus reading on How MySQL executes ORDER BY.
Special Mention
I have used a third party javascript library for parsing the SQL Queries. This libary is called simpleSqlParser and it's an awesome library, without which it would have been very difficult.